

�մǰ��DzԳٴ�’s secret flood map �մǰ��DzԳٴ�’s secret flood map
As climate change worsens rainstorms, are you at risk of a flood?
With a three-foot high-water mark tattooed on her basement walls and an inventory of ruined possessions, Blair Audet lived for months in a fog of stress and fear. But later, looking at a flood map, she felt a new emotion: confusion.
The official map of �մǰ��DzԳٴ�’s flood-vulnerable zones showed that her neighbourhood was not in a high risk area. And yet stormwater had surged through Audet’s home. Some of her neighbours had flooded, too.
When Audet and her husband, Jon Salvatore, bought the house months earlier — their first home, and biggest purchase of their lives by far — they had done everything they could to protect themselves. Not content to rely on the sellers’ home inspection, they had a contractor friend do another walk-through.
As for assessing their flood risk, they peered down the closest major street and felt reassured they were on top of big hill — an unsophisticated analysis, with no real alternative. Now, Salvatore and Audet, who was five months pregnant, were tearing out sodden drywall and trying to salvage precious photographs. Audet was terrified the financial shock could cause them to lose their home, right before they welcomed their first child.
What the couple did not know — and what thousands of other Torontonians have no way of knowing — is that their home sat directly in the middle of a hidden flood risk.
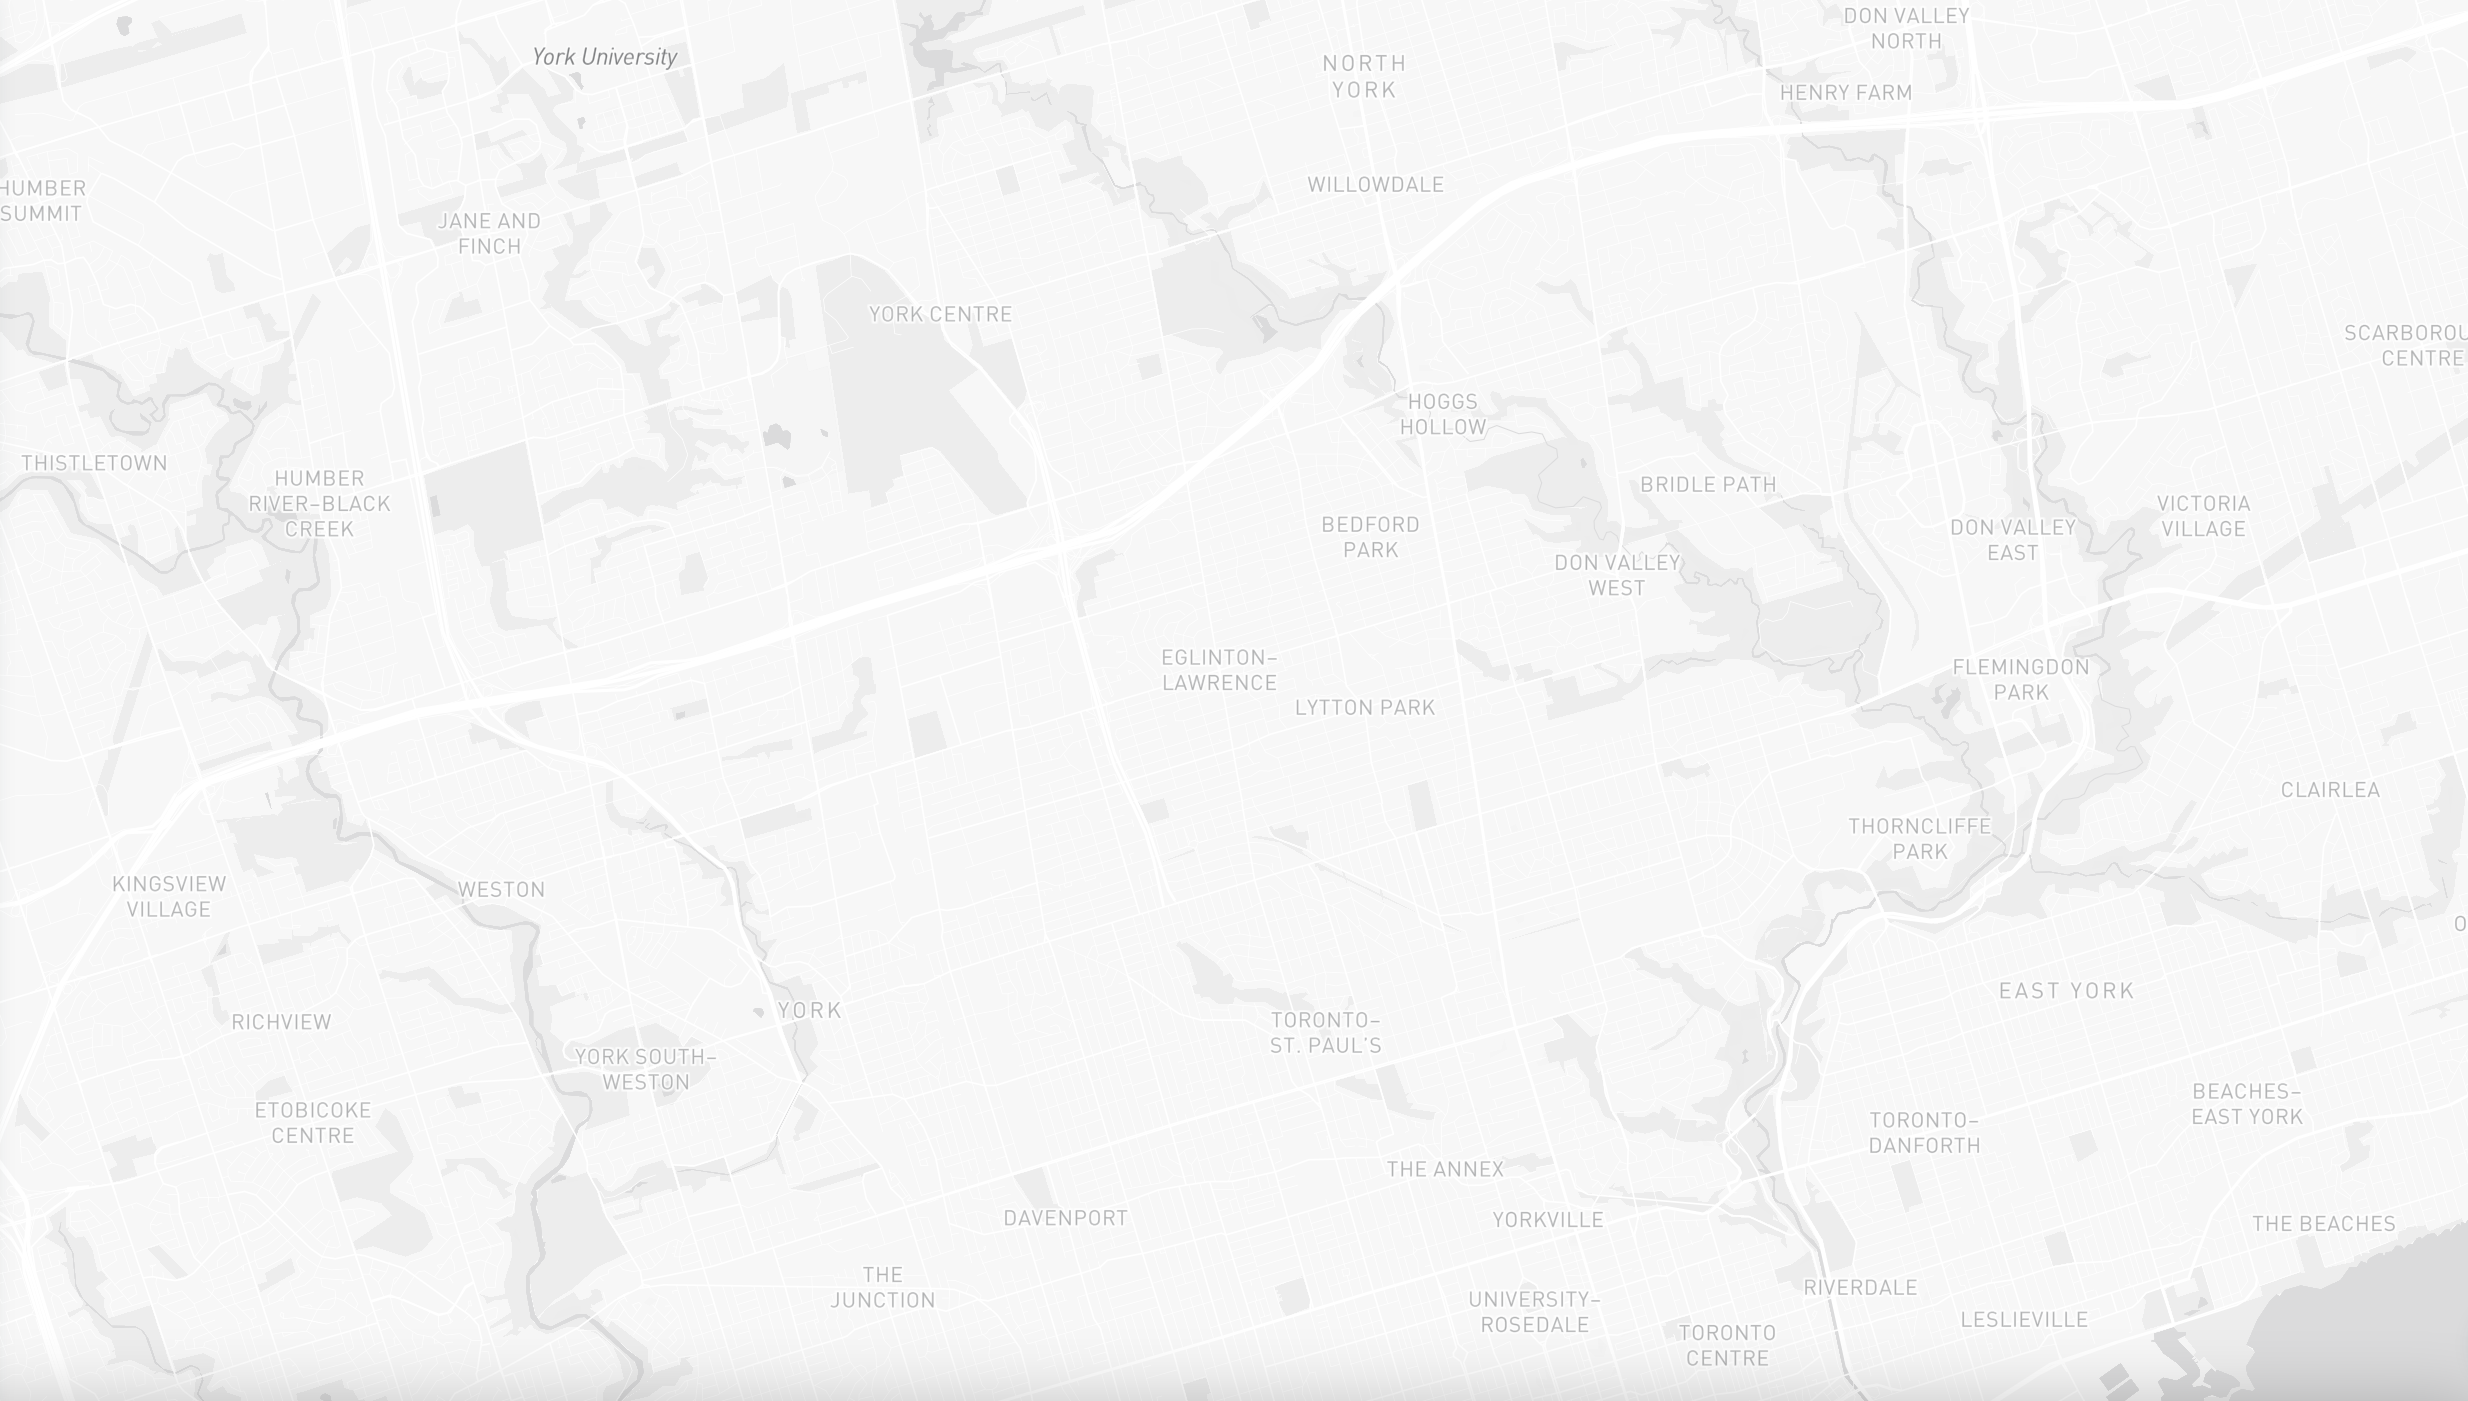
- This map includes uncertainties and simplifications;
- Just because a location falls inside/outside of a flood risk zone does not mean it is at risk/not at risk;
- Each flood polygon (or the grid block that represents the flood extent and depth) is 30m x 30m;
- The model simulates how water flows across a digital representation of Toronto, so it can overlook the complexities of how water flows over and around roads and buildings;
- It doesn’t account for the complex interplay between fluvial and pluvial risk: water may become even more backed up on roads that usually discharge into rivers when those rivers are overflowing, for example;
- It assumes a standard drainage capacity across the whole city, meaning it doesn’t take into account where flood defences have been upgraded (or where they are worse).
In Ontario, official floodplain maps show the areas that would be covered by water if rivers and other water bodies overflowed their banks in an extreme storm. This is known as “fluvial” flooding. Flooding caused by overflowed bodies of water
But what those maps ignore is a different kind of threat: surface flooding, which happens when rainfall is so great that it overwhelms sewers and drainage infrastructure. This is known as “pluvial” flooding. Flooding caused by rainfall
Governments, insurance companies and developers all have access to maps that combine both flood risks. But the public does not, leaving average residents in the dark.
The Star worked with researchers at the University of Waterloo’s Climate Risk Research Group to create such a map.
Researchers Jason Thistlethwaite and Daniel Henstra made the map under a data-sharing agreement with JBA Risk Management, a company that has made flood maps for the Canadian government, insurers and users all over the world.
It models an extreme rainfall event known as the “100-year storm.”
It’s important to note this map should be seen as a starting point, not a certainty. It uses a generalized flood modelling approach, and relies on many assumptions and simplifications.
One assumption is that drainage capacity is the same across the whole urban area, meaning the impact of flood defences is limited. The map likely overestimates the risk in some places, and underestimates in others.
What this map shows without question is that an enormous amount of flood risk in ������������remains hidden from the public. This leaves residents deprived of information necessary to protect themselves, and ill-equipped to engage in a truly democratic discussion about how our city must evolve in the face of a worsening climate-fuelled threat.
Explore for yourself
The flood that hit Audet and Salvatore’s home came after a The same deluge halted subway service, floated cars and trapped two men in an elevator as water rose rapidly, forcing police to make a dramatic rescue with just a foot of breathing space left.
In some parts of west-end Toronto, according to the ������������and Region Conservation Authority, enough rain fell to qualify as a “100-year storm” event — a title that is both cinematic and misleading.
It does not mean such a storm can only happen once a century, a truth ������������has learned the hard way.
Just five years earlier, in July 2013, another storm exceeded the 100-year threshold in parts of the western GTA. Torontonians may remember this storm for an image of a silver Ferrari abandoned in a flooded underpass, while meteorologists remember it for breaking the single-day rainfall record set nearly 60 years earlier during Hurricane Hazel. In 2005, another greater-than 100-year-storm wreaked havoc. That’s three “100-year” storms deluging parts of ������������in less than 15 years, collectively costing more than $1.5 billion in damages.

The “100-year storm” is just a statistical probability: it means that a rainfall event of this intensity has a one per cent chance of occurring on any given year. Because the GTA is so big, the chances of a storm this bad happening somewhere within its boundaries are higher than one per cent, and just because one happened the year prior doesn’t mean it can’t happen again the next.
Climate change, however, is also tipping the scales in favour of these extreme storms.
A warm atmosphere holds more moisture, and one of the climate projections Canadian scientists are most confident about is that global warming will increase rainfall extremes and intensify urban flooding. In a future where humans send high levels of greenhouse gas emissions into the atmosphere, a 50-year rainfall event, a storm with a two per cent chance of occurring in a given year, will likely happen once every 10 years by the end of this century, according to
Flooding is about more than just rainfall: conditions on the ground also strongly influence flood risk, especially urban development and densification — which is also rapidly expanding in Toronto.
The rising dangers of flooding — and the gargantuan costs of recovery — have driven other countries to put more information in the hands of the public. In the U.K., anyone can type their postal code into an online portal and instantly see their risk from both surface, river and ocean flooding.
In Canada, governments have created their own internal flood maps and pledged to better inform the public. But flooding experts say these efforts have so far left Canadians woefully misinformed.
“I frankly think it’s bad politics. No government is interested in being accountable for the costs of development that they’ve allowed in high-risk areas,” said Jason Thistlethwaite, co-lead of the University of Waterloo’s Climate Risk Research Group and professor in the School of Environment, Enterprise and Development.
“If they keep the public in the dark about this, they can quietly pass on responsibility to individuals and then blame you for the hardship caused by development decisions and policy decisions that they have ultimately made.”
Responsibility for flood mapping is “opaquely divided,” Thistlethwaite added, making it “just so easy to pass the buck.” Federal, provincial, and municipal governments all share the job.
Last year, Public Safety Canada published a report that included what was described as the “the most robust flood hazard and damage analysis ever completed in Canada.”
To carry out that analysis, a data team at Public Safety procured flood models from three different firms that provide modelling and mapping for Canadian and global insurance markets, including JBA Risk Management. The team used those models and other data to estimate an average annual flooding cost for every residential address in Canada — an estimate that totalled $2.97 billion nationally, much higher than previous figures.
Public Safety — but not the maps or the estimate for residential addresses created to inform it, despite concluding that “risk awareness of Canadians must improve.” The report cites a national survey conducted by Thistlethwaite and Henstra, which found that only six per cent of Canadians know they live in an area designated as high risk for flooding. (The researchers are thanked in the report for providing time and expertise, but weren’t part of the task force that created it.)
There is no reason these maps can’t be made public, the researchers say.
“Part of this, I think, is a kind of irrational fear that the government is going to take all kinds of flack on this … there’s the assumption that there’s some sort of legal liability,” said Henstra, co-lead of the Climate Risk Research Group and a professor of political science at University of Waterloo.
“I think it’s far worse from a good-government standpoint to have this information and not make it available to the public. I think it’s just unconscionable that we would be doing that.”
In response to a list of questions from the Star, Public Safety Canada did not address why it chose not to make this information public.
A spokesperson highlighted two flood-related efforts, the $164.2M Flood Hazard Identification and Mapping Program and a publicly accessible online portal promised in the last budget. The inventory of maps from the flood hazard identification program is, to put it mildly, not user-friendly, and contains maps that are either not public or require specialized software to interpret. The $15.3 million portal does not yet exist: “Program details are being developed and will be communicated to Canadians in due course,” the spokesperson said.
Modelling something as complex as an ever-changing city is inherently difficult, and the map Thistlethwaite and Henstra created with JBA Risk Management includes other uncertainties and simplifications:
- The model simulates how water flows across a digital representation of Toronto, so it can overlook the complexities of how water flows over and around roads and buildings;
- It doesn’t account for the complex interplay between fluvialFlooding caused by overflowed bodies of water and pluvialFlooding caused by rainfall risk: water may become even more backed up on roads that usually discharge into rivers when those rivers are overflowing, for example;
- As previously mentioned, it assumes a standard drainage capacity across the whole city, meaning it doesn’t take into account where flood defences have been upgraded (or where they are worse).
The Public Safety analysis compared all three private-company models to high-resolution engineered flood maps to assess their accuracy, and found some overestimated flood hazard and some underestimated, but that their performance was acceptable — especially because it is incredibly difficult to produce maps that combine pluvial Flooding caused by rainfall and fluvial Flooding caused by overflowed bodies of water flooding across such a broad territory as Canada.
“We have to start somewhere,” said Thistlethwaite.
“There’s a strong public appetite for flood risk information,” said Henstra, citing the where they found 90 per cent think that flood maps produced by the government should be publicly available.
“This is Canada’s most significant climate change risk. It’s getting worse, and we need as much information out there as we can get. Those who disagree with the information should produce new information, and we should get it all out there and have a discussion about it.”
As homeowners such as Audet, aspiring first-time buyers and basement tenants are left without knowledge of their flood exposure, insurers do have access to flood maps produced by JBA Risk Management and other companies.


Craig Stewart, vice-president of climate change and federal issues with the Insurance Bureau of Canada, agrees the public deserves to know their risk, and is encouraged that the federal government has committed to developing the flood portal.
The maps that insurers have are “coarse,” showing “undefended” flood hazard instead of actual risk and it would be ideal if the information that cities have could be incorporated. Public Safety Canada’s map is probably “the best flood map for the country that anybody has,” Stewart said.
Insurance companies are not able to release the maps they use themselves because the data is “proprietary,” he added. But even if they could he doesn’t think it would be that helpful. Stewart believes what’s needed is a consumer risk score that is consistent across the country, taking into account not only flood exposure but also local defenses.
Better disclosure when homeowners buy a home, get a mortgage and purchase insurance is also key, he said. In several states, including California, and , sellers must disclose flood risks to buyers, by law.
The city of ������������does have detailed maps from outside consulting firms that examine how infrastructure such as sewers and flood defences interact with projected storm scenarios. But they are not publicly available. The city is working to make them meet the Accessibility for Ontarians with Disabilities Act (AODA) so that they can all be online by next year. They are currently available on request, said spokesperson Kaitlyn Forde in an email.
The maps were developed with an “engineering focus, let’s go figure out what we need to build,” said Lou Di Gironimo, general manager of ������������Water, in an interview. But now that they exist, he agrees they could be a resource for the public.
������������Water has been working on for about 20 years, following a series of bad storms that left frustrated residents with waterlogged basements, and there’s now a budget of $2.1 billion allocated over the next decade just for such projects, Di Gironimo said.
But there have been some unexpected bumps along the way.
It took $25 million to extract a tunnel boring machine that famously got trapped in spring 2022, at Old Mill Drive in Parkdale-High Park, leading Mayor Olivia Chow to joke that it should be gold-plated and put on display at city hall. Since the boring machine got stuck, the city has identified five complaints about flooding in the area, Forde added.
Di Gironimo called the incident “extremely unfortunate.”
Inflation is another problem, with some projects doubling in costs and forcing tough decisions about priorities. “I do less work because I only have the same amount of money coming in,” he said.
It makes some sense that local governments, which know their own flood defences best, are managing urban flood risk, said Henstra.
But a lack of co-ordinated leadership at other levels of government means the cost and responsibility for this type of flood protection has been downgraded onto municipalities already struggling with budgets and other challenges.
Provincially, the Ontario government has mandated conservation authorities to produce flood maps — but only for fluvial Flooding caused by overflowed bodies of water flooding. Marcela Mayo, a senior issues adviser with the Ministry of Natural Resources and Forestry, confirmed in an email that the province’s primary focus is preventing flooding from lakes and rivers, but that it is “working to develop an urban flooding framework,” by spring 2024, that will outline roles and responsibilities — but won’t create maps for the public.
In addition to the federal government and insurers, developers also sometimes know the full extent of flood risk.
These “big real estate holding or management companies, that have portfolios across the country” then use that information to sell and divest, said Tamsin Lyle, principal engineer at Vancouver-based Ebbwater Consulting Inc., which provides clients with flood management solutions.
Meanwhile many individuals are totally caught off guard when their home floods, especially when they don’t live next to a body of water, she said.
Her firm notices a spike in calls about flooding every time there’s a big event, like the 2018 storm that flooded Audet’s basement.
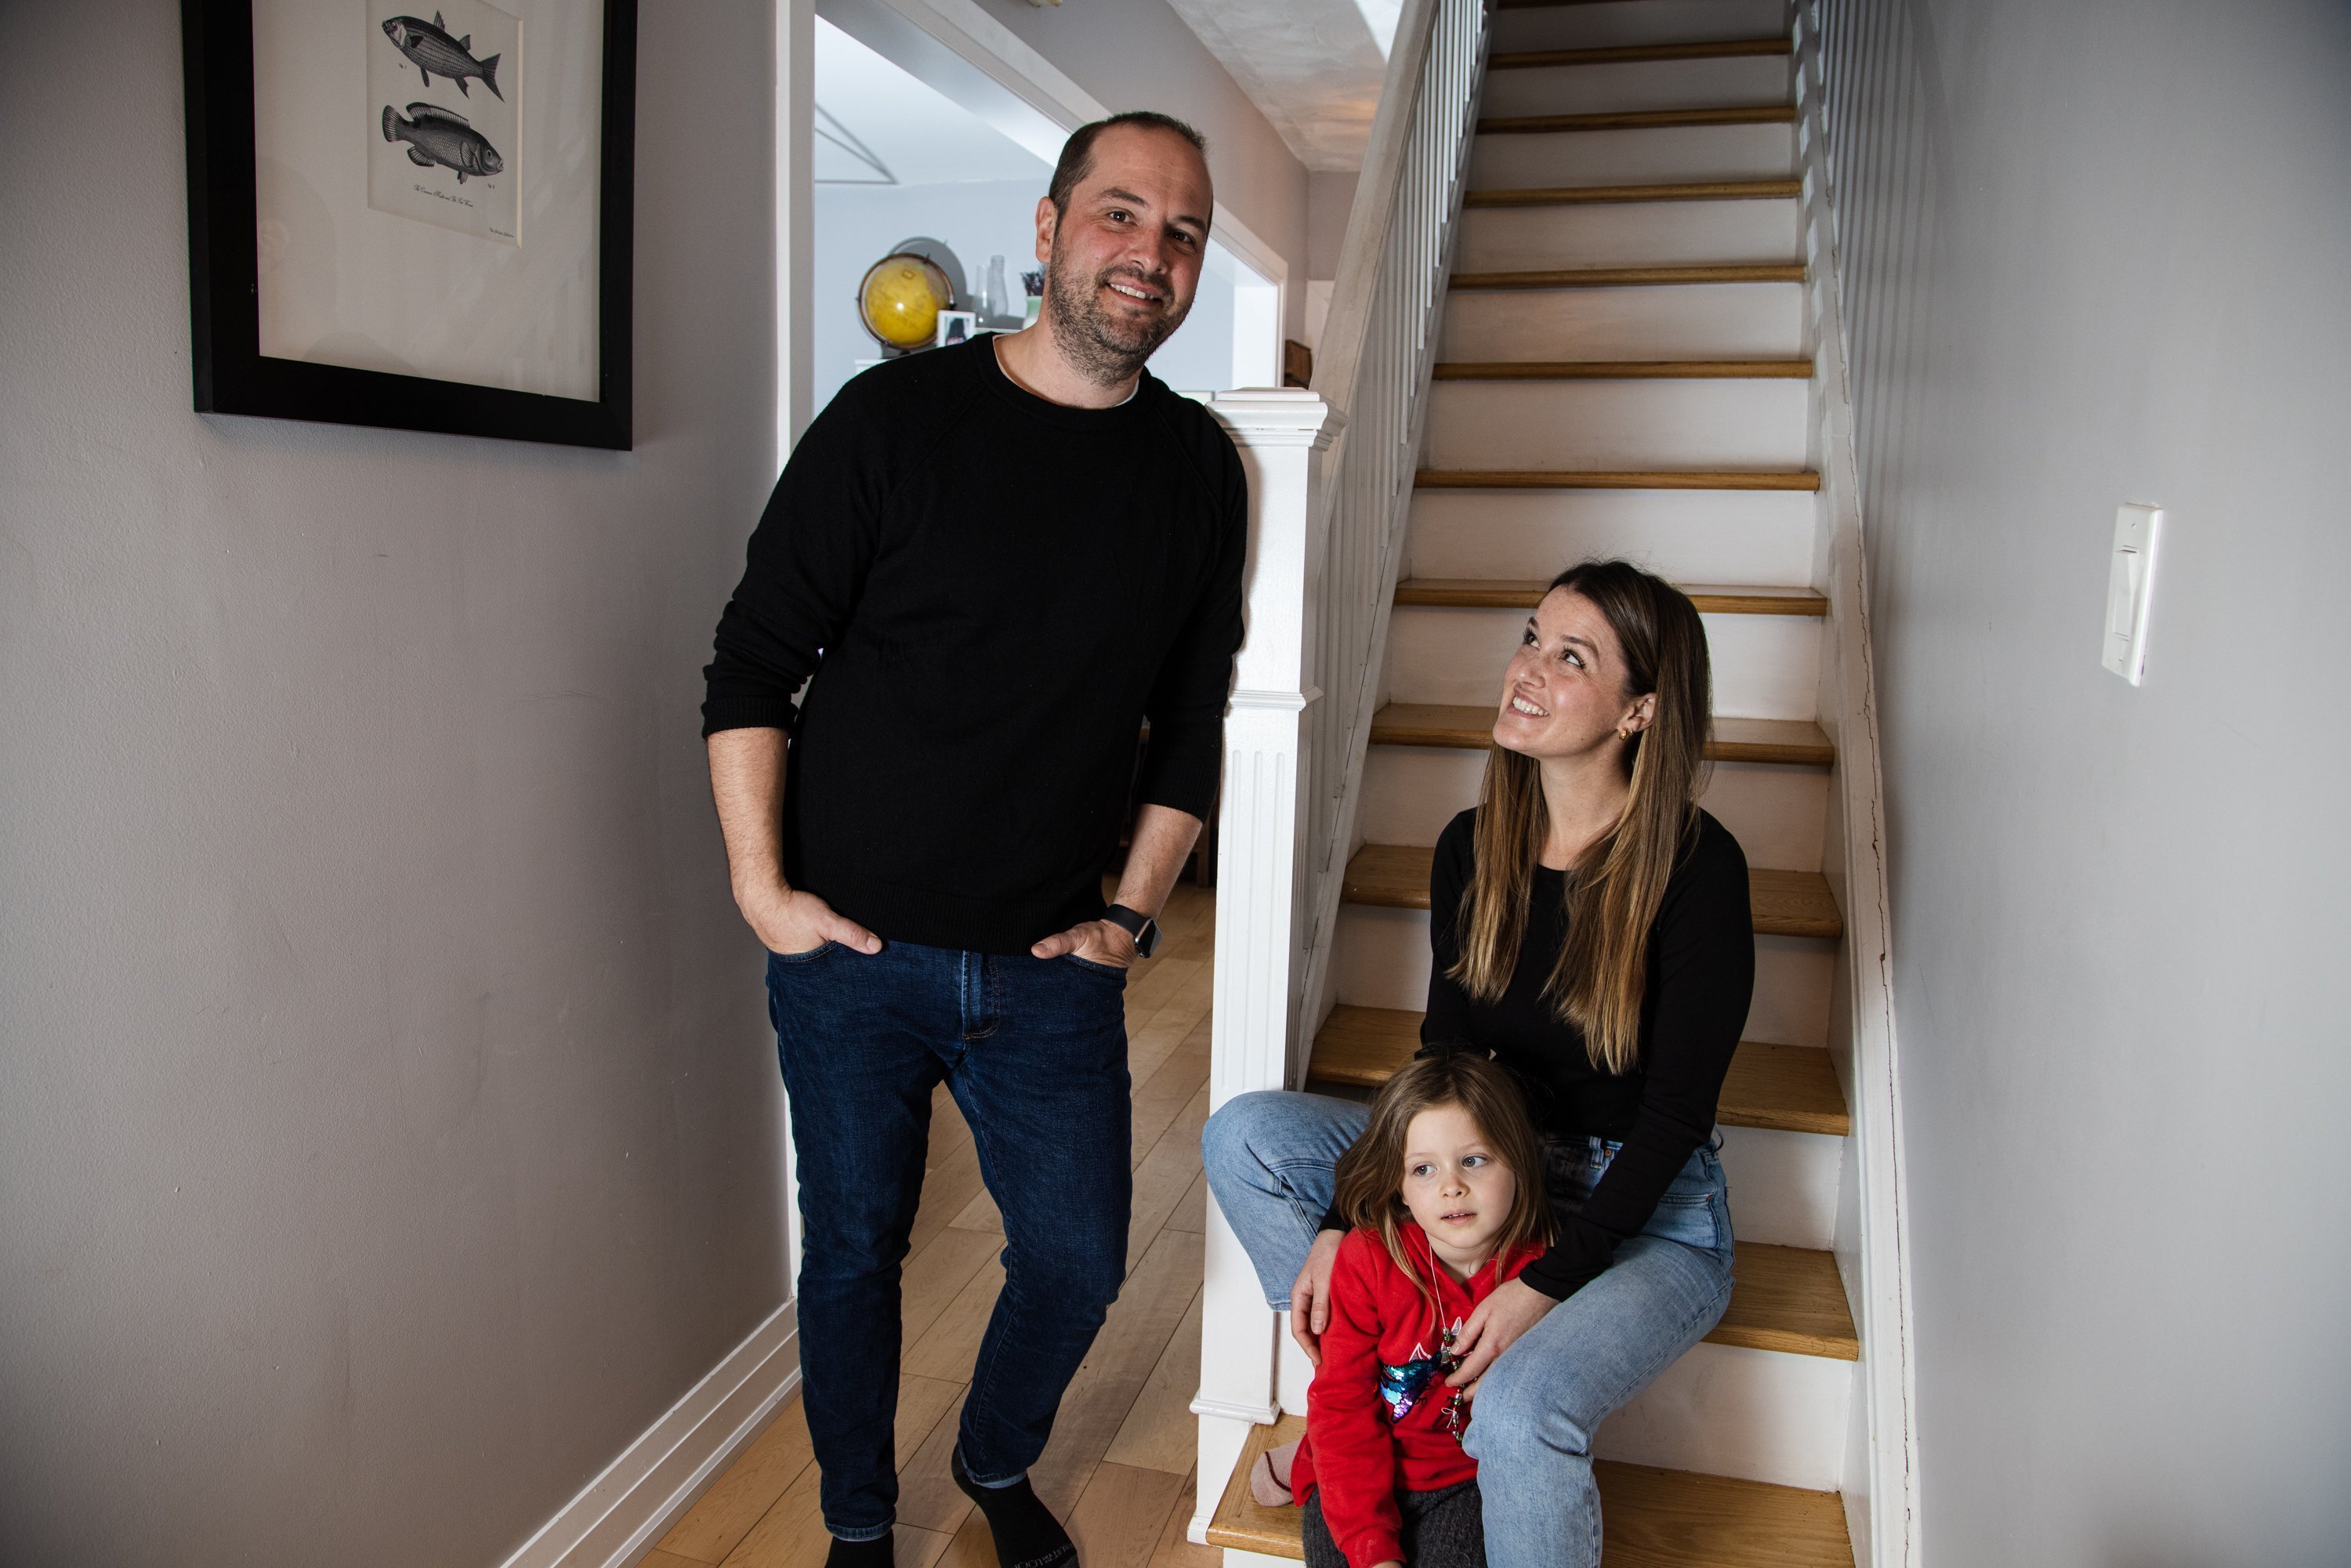
Audet, 38, remembers being “terrified” every time it rained for years afterwards, even though they installed a backflow valve. Five years, two babies and a pandemic later, she is still emotional about the disaster.
“That feeling of exhaustion and dread was pretty visceral,” she said.
The couple salvaged what they could and installed new drywall themselves. Exhausted and trying to prepare for the birth of their first child, once their insurance claim was resolved weeks later, they did what they could and left the rest.
If the couple had known they were at risk of any of this, they might have thought twice about buying the home. They definitely would have installed anti-flood measures as soon as they moved in.
“It’s the biggest purchase I’ll ever make in my life. It doesn’t seem fair to not have information that exists,” Audet said.
“That’s not an informed decision.”


